When Value is More Valuable
Growth stocks outperformed value stocks this quarter by a margin of about 4% globally. This continues a near decade-long stretch in which expensive stocks in hot sectors have done better than cheaper stocks in less sexy corners of the market.
We can’t say how long this great growth rally will continue. We believe, however, that the best predictor of future returns isn’t what did the best last decade. We all saw how well that worked out for emerging market and commodity bulls in 2007. Rather, we believe investors should focus on today’s prices: buying assets that are cheap relative to history and avoiding things that have run up in price.
So which equities are cheap and which are expensive? How are growth and value stocks priced relative to long-term historical averages? And where should believers in mean reversion be placing their bets?
To test these questions, we analyzed the monthly data from the University of Chicago’s CRSP data set for all US stock returns and valuations from 1926 through January of 2019.
We looked at the valuation spreads and total returns of the most extreme two deciles of univariate-sorted, equal-weighted* portfolios of value and growth stocks (defining growth as the 10% of most expensive stocks on price-to-book and value as the cheapest 10% of stocks on price-to-book). Below are the valuation spreads over the last ~100 years in the US market between the tenth and first deciles of value and growth stocks. We have also included the quintiles breakpoint spreads.
Figure 1: Valuation Spreads Over Time (Market/Book Value of Equity for High/Low Deciles)

Note: Spreads calculated on the 90th and 10th percentile and 80th and 20th percentile breakpoints of all US stocks sorted by market value of equity divided by book value of equity from the Ken French data.
This graph shows that the most expensive stocks in the market have traded around 5.6x the valuation multiple of the least expensive stocks in the market over long periods. Note that there are only two other periods that have seen greater valuation spreads than we see today: the peak of the dot-com bubble and the run-up to the Great Depression.
Over the last decade, valuation spreads have gone from being below their historical median to being some of the highest in US market history. Investors are paying much, much more for growth stocks relative to value stocks than they were a decade ago, and those higher valuations have driven growth’s outperformance.
What does this mean for the relative returns of value and growth portfolios historically? Below we have layered in the annualized one-year forward relative returns of value minus growth on top of the growth/valuation decile spreads for the last 80 years since 1940.
Figure 2: Hi/Low Decile Valuation Spreads and 1-Year Forward Value-Growth Relative Performance
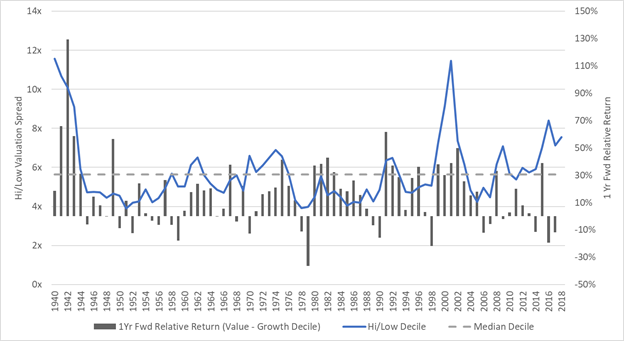
Source: Ken French data. We focus on 1940 onward here as there are several issues with the CRSP data set before then, including a limited number of stocks (~400) to sort pre-1940.
Extreme tenth-decile, equal-weighted value portfolios have dramatically outperformed extreme equal-weighted portfolios of the most expensive stocks in the market. However, extreme value portfolios generally do worst on a relative basis during periods of widening valuation spreads. Conversely, as spreads mean revert downward, value tends to outperform. Ironically, this means that value typically looks like a worse strategy on short-term trailing results precisely when it has the highest relative forward returns.
In 2018, valuation spreads between growth and value stocks were at 7.6x, according to the Fama-French data. This is 34% above the historical median of 5.6x since 1926 and 47% above the median since 1940. In 2005, that number was at 4.2x, or 25% below the historical median. Is it any surprise looking back now that value has had a tough run over the last decade?
Below we include the base rates for tenth-decile, equal-weighed value’s performance relative to growth since 1929. We show the results of owning that value portfolio when value is historically cheap relative to growth and when it is historically expensive.
Figure 3: Relative Annualized Alpha for Hi-Low Market/Book Portfolios by Valuation Spreads

Note: Returns are the average relative returns for owning the portfolio during periods when spreads were greater than the historical median +x% or less than the historical median -x%. Five-year prior return for “2018” is for the period ending 28 Feb 2019. Ken French data.
In 2019, looking back on one of the market’s most prolonged growth rallies ever, spreads are now about the widest they have been since the run-up to the Great Depression and the dot-com bubble. Of course, spreads can always widen more in the short term, but we see something extremely attractive in the historical base rates for investing in value after it has disappointed and spreads are wide.
If you have made the decision to hold exposure to stocks for the long haul, 2019 looks to be a particularly unique period of market history where demand has crowded significantly into growth stocks and away from value stocks. Despite the consensus implied by the now widely divergent valuations, the base rates would suggest you would be wise to do the opposite of that consensus.
Notes:
* If you are a larger stock allocator looking for analysis that is relevant for investing $1bn+ in equity markets, you should turn away now. The tenth decile of equal-weighted value is mostly small- and micro-cap stocks. It is “economically insignificant” for large investors and incurs too much trading friction to execute for multi-billion-dollar check writers. However, if you can access capacity-constrained strategies, this is a much more relevant analysis for you. The value-weighted historical premiums for these value deciles are dramatically lower than those not effectively excluding micro-cap stocks in the equal-weighted portfolios.