Fool's Yield
Credit investors are the cynics of Wall Street. While equity investors are asking questions like “how many electric cars can Tesla sell in 2025?”, credit analysts are asking what could go horribly wrong. They stare at asset values, interest coverage ratios, and free cash flow generation to puzzle out whether a company will be able to pay its debts.
Yet even the cynics of Wall Street can’t deny the animal spirits that arise in bull markets. While the temptation of equity investors is to extrapolate high recent growth rates far into the future, the temptation of the credit investors is to extrapolate low recent bankruptcy rates into the future. This is a particular problem today, when recent default rates have been materially lower than the historical average.
Figure 1: Average 5-Year Cumulative Issuer-Weighted Global Default Rates by Credit Rating

Source: Moody’s Annual Default Study. February 1, 2019
The difference is most stark in BB and B rated bonds – and it is here we see a growing problem for credit investors. We call this problem “fool’s yield.” This is the yield above which the losses from defaults overcome the higher coupon payments and investors end up earning lower total returns than they would have buying lower yielding, higher rated bonds. Like fool’s gold, fool’s yield is shiny and attractive on the surface but worthless to the trained eye.
A study of long-term credit market data reveals that fool’s yield is a persistent phenomenon in corporate credit markets. Over the past 22 years, bonds rated B and CCC have had lower total returns and a much lower Sharpe Ratio (return/risk ratio) than higher rated, but lower yielding, BB bonds.
Figure 2: Risk & Return Characteristics of Corporate Bonds 1997–2019

Source: FRED, ICE BofAML Indices. January 1997 to March 2019.
Average yields rise as credit ratings decline, from an average yield of 4% for high-quality AAA bonds, to an average yield of almost 15% for CCC junk bonds. But realized returns and Sharpe Ratio peak in the BB category. The BB credit rating category appears to be a fulcrum point for risk-adjusted returns. While riskier bonds in the B and CCC categories offer much more attractive yields, they end up producing worse returns with far lower Sharpe Ratios due to their high level of defaults.
This is even more evident in looking at individual bond data. The chart below shows the average experience in all months since 1997 of buying and holding bonds at each market-implied credit rating to end-of-life.
Figure 3: Buy and Hold Returns vs. Yield

Source: Verdad analysis. Data is for developed market corporate bonds (excludes financials and utilities) from January 1997 to February 2019.
As you can see, below BB3, investors are simply taking more risk to realize the same return that could be had with less risk. The best returns in corporate debt are in the middle ratings buckets (BB1 to BB3) where default rates are low, yields aren’t high enough to attract fools, and institutions with investment-grade mandates can’t play.
But it’s hard to get investors excited about the goldilocks opportunity in not-too-high-yielding but not-too-high-defaulting BB bonds. So most investors in corporate debt still tend to flow to either end of the barbell, preferring the least risky AAA- or AA-rated corporate bonds that offer yields little better than treasuries or reaching for the sexy-but-dangerous yields in the B and CCC arena.
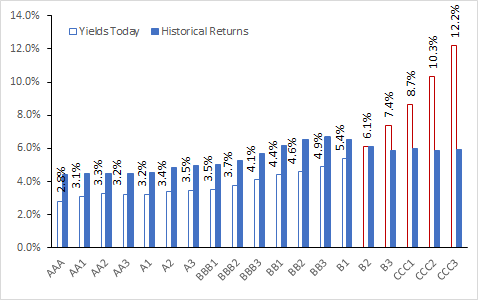
To estimate where the fool’s yield lies in today’s credit markets, we plot today’s yields by market-implied credit rating category. Next to today’s yields, we show the historical realized return of each market-implied credit rating category.
Figure 4: The Fool’s Yield
Source: Verdad analysis. Data is for developed market corporate bonds (excludes financials and utilities) from January 1997 to February 2019.
If history is a guide, buying anything today that yields 6.1% or above is likely to result in disappointment as realized returns fail to match the yield at purchase. On the other hand, buying BBB and BB bonds with yields of 4–5% is likely to deliver returns of around 4-5%. This average 5% return from BBBs and BBs is equivalent to what would be achieved by buying B and CCC bonds yielding 6–10%, but with much less volatility.
But what is an investor to do if 5% is not enough to meet return targets? The answer for many pensions and endowments has been to flee the liquid credit markets in search of “alternatives.” Historically, hedge funds have taken in the capital that fled corporate credit, but as hedge funds have fallen out of vogue, investors are now turning increasingly to the private credit and direct lending markets. The promise is that floating-rate senior secured loans to smaller companies can deliver higher and safer returns than in the lower-yielding, liquid public markets.
We suspect that the higher yields offered in private credit and direct lending are fool’s yields as well. Issuer size and net debt/EBITDA are two of the best quantitative predictors of future default rates. Below, we show a graph comparing the average loan made by two large business development corporations (a proxy for the broader private credit space) to the liquid corporate credit markets by credit rating. Today, these private loans are yielding between 10% and 11%, whereas public B bonds yield 6.5% and CCC bonds yield over 11%.
Figure 5: Private Credit vs. Liquid High Yield

Source: Public filings, Verdad analysis
Private credit is much smaller than the typical CCC bond, but with a net debt/EBITDA level similar to B bonds. On these key metrics, private credit is in fool’s yield territory. Historically, private credit returns have failed to outperform the broader high-yield market.
In these times of low interest rates and low default rates, investors might be tempted to reach for yield, piling into lower-rated corporate debt and high-fee private credit funds. But long-term historical base rates suggest that this is fool’s yield—that investors in these securities will end up paying the piper for their juicy current yields when the inevitable wave of defaults occurs.
Corporate credit is one of the largest, most liquid markets in the world. In our next two weekly research notes, we will explore why investors have fled from the asset class and what our research suggests about how to successfully invest in it.