Persistence of Growth
Twenty-five years later, and we still can’t find evidence of persistent growth
By: Brian Chingono and Greg Obenshain
Expectations of future earnings growth matter a great deal to valuations. Investors tend to assign higher valuations to companies they think will grow quickly in the future, whereas firms that appear to have slow growth prospects are generally assigned lower valuations.
The Discounted Cash Flow Model, which serves as the workhorse of corporate finance (and also doubles as an instrument of torture for first-year investment banking analysts) directly links future growth estimates to current valuations. In this model, small changes in the perpetual growth assumption can have large effects on the implied valuation of a company, as many banking analysts have discovered when they’re trying to “hit the right number” in time for the next morning’s presentation.
An implicit assumption in most of these models is that growth is persistent. Analysts underwrite high growth for companies that have grown quickly in the past and slow growth for companies that have grown slowly in the past.
We can see evidence of this persistence assumption by looking at broad index data. The Vanguard US Growth Index consists of companies that have grown their earnings by 28% on average over the past five years. These growth stocks are priced at 29x their trailing net earnings, a 52% premium to the overall US market’s 19x Price/Earnings ratio. The average company in the US market portfolio has increased earnings by 20% annually over the past five years, an impressive number that seems to warrant similar discount rates between the overall market and growth stocks.
How wise is it to assume (and pay for) persistence in earnings growth? In their seminal 2001 paper, The Level and Persistence of Growth Rates, Chan et al. looked at annual growth rates across all US firms from 1951 to 1997. After carefully conducting tests on multiple measures of earnings, the authors concluded that “while some firms have grown at high rates historically, they are relatively rare instances. There is no persistence in long-term earnings growth beyond chance.”
We wanted to see how this finding has held up over the last 25 years, especially in light of the popular narrative of “secular changes” that have supposedly altered the economy—and the calculus of investing—in recent decades. We wanted to see if the higher valuations for growth stocks we’ve seen recently are justified by a higher level of persistence of growth rates. We looked at all US stocks between 1997 and 2022 to cover the out-of-sample period since Chan et al.’s paper was published. Our out-of-sample results corroborate the original paper’s conclusions. Using the same methodology as Chan et al., we found little to no evidence of persistence in earnings growth, beyond chance, over the long term.
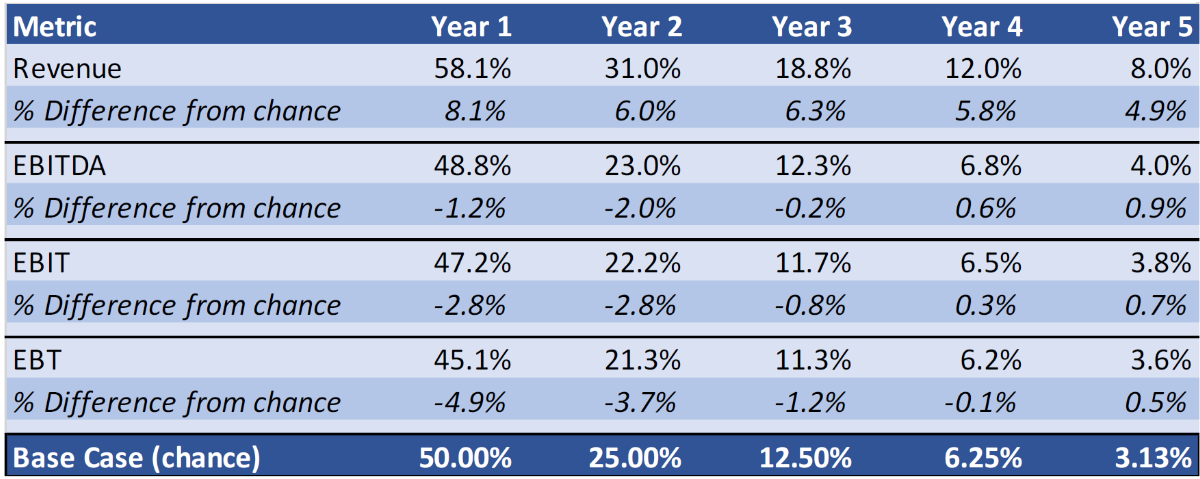
In the table below, we show the proportion of all US companies that sequentially have above-median growth over forward annual periods ranging from one year to five years in a row. For example, within the data, companies that grow above the market median for three years in a row are tagged with a one, and all other companies in the three-year column are tagged with a zero. The average of that three-year binary column gives us the proportion of companies that outgrow the median each year for three years. This sequential measure of three-year persistence is compared against the probability of randomly flipping the same side of a coin three times in a row (12.5%).
Figure 1: Persistence of Growth Rates (1997–2021)

Source: S&P Capital IQ and Verdad research
As we can see in the table above, there appears to be some, but not much, persistence in revenue growth. But in all three measures of earnings growth (EBITDA, EBIT, and EBT), there is little to no evidence of persistence beyond chance. These out-of-sample results are consistent with the original findings by Chan et al. It seems that any secular changes in the economy over the past two decades have not changed the basic conclusion that earnings growth is not persistent beyond chance over the long term.
What if we focus specifically on firms that have demonstrated the highest level of earnings growth in the past? Would the highest fliers of the past have a better chance of maintaining above-median growth in the future?
To answer this question, we adjusted our analysis by isolating firms that were in the top quartile of growth over the previous year. We then looked at what proportion of these past top-quartile winners were able to maintain above-median growth over the next one to five years in a row. The results are shown below, and, as before, we separate the role of chance by comparing against a series of random coin flips.
Figure 2: Persistence Among Firms Starting in the Top Quartile (1997–2021)
Source: S&P Capital IQ and Verdad research
When focusing specifically on past top-quartile winners, there seems to be relatively more persistence in revenue growth. But as we move further down the income statement toward earnings measures that matter the most for investors, we find that any persistence beyond chance approaches zero. Even among past top-quartile winners, future persistence in the growth of earnings before tax (EBT) is indistinguishable from random coin flips over the long term.
But, one might object, analysts really care about the compound annual growth rate, not whether growth hits every year in succession. Therefore, we also looked at cumulative growth over the next one to five years to see whether past winners continued to outgrow the market median on a cumulative basis. In this analysis, we focused on EBITDA growth and split the sample into five groups (quintiles) based on EBITDA growth in the past year. We then measured the proportion of companies that have above-median EBITDA growth over the next one to five years cumulatively. Since each cumulative measurement is equivalent to a single coin flip, the benchmark for chance is 50% in each case. As shown in the table below, the outcomes for the highest-trailing growth quintile are indistinguishable from the outcomes in the lowest-trailing growth quintile. Past winners essentially have the same long-term outcomes as past losers in terms of cumulative EBITDA growth.
Fig 3: Cumulative EBITDA Persistence by Previous 1Yr EBITDA Growth (1997–2021)
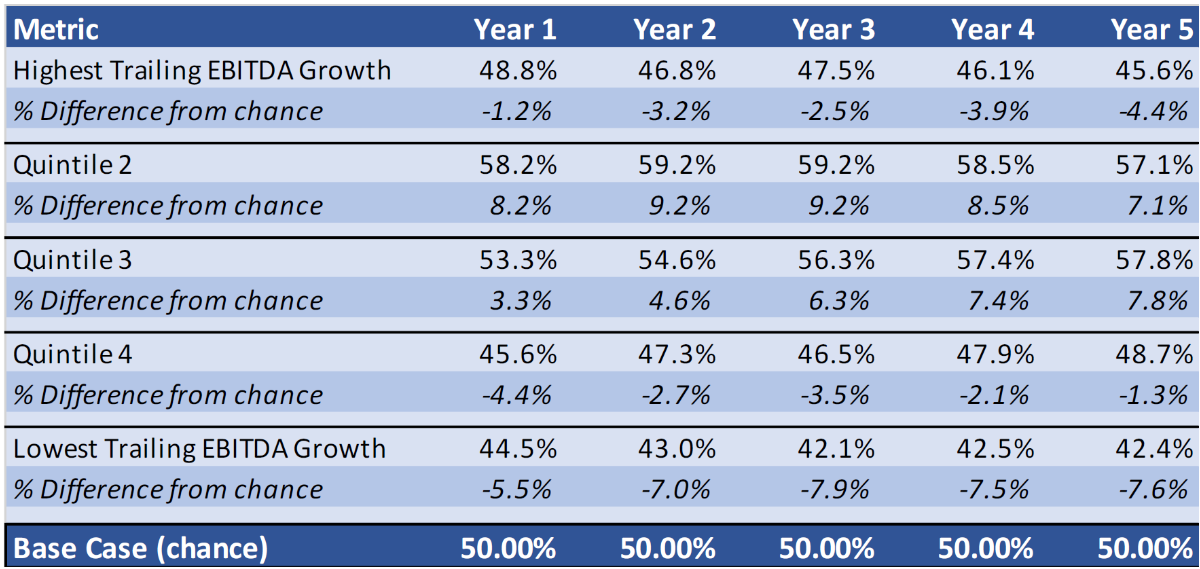
Source: S&P Capital IQ and Verdad research
When building a DCF model, it seems analysts might as well plug in the same long-term growth assumption for a SaaS software company as when valuing a coal miner. This striking conclusion is consistent with Chan et al.’s original paper as they wrote: “Our median estimate of the growth rate of operating performance corresponds closely to the growth rate of gross domestic product over the sample period. Although there are instances where firms achieve spectacular growth, they are fairly rare … It is difficult to see how the profitability of the business sector over the long term can grow much faster than overall gross domestic product.”
So while future earnings growth may not be predictable from past earnings growth alone, perhaps there are other metrics than can provide an indication of future earnings streams. We’ll explore these predictive measures in the next installments of our research series.
Appendix A: International Evidence
In the table below, we test sequential persistence in the international developed markets of Europe and Japan. The table shows the proportion of companies that sequentially have above-median growth over forward annual periods ranging from one year to five years in a row.
Figure 4: Persistence of Growth Rates in Europe and Japan (1997–2021)

Source: S&P Capital IQ and Verdad research
The outcomes of this international test are consistent with our results in the US, as there is little to no evidence of persistent growth beyond chance.