Fair Multiples
How should we estimate the terminal multiple?
By: Dan Rasmussen and Greg Obenshain
Last week, we showed that predicting which companies will have the highest growth does not necessarily lead to higher returns. The main reason is that growth rates mean revert downward—and so do valuation multiples. The challenge of growth investing, therefore, is that the benefits of strong growth in the short term are often offset by losses from changes in multiple that reflect the mean reversion of growth in the long term.
Terminal value assumptions are one of the most important drivers of the discounted cash flow model. But too many fundamental analysts simply assume that the exit multiple will equal the entry multiple, and quant models too often assume full mean reversion. We think the importance of these assumptions warrants greater scrutiny. So we set out to predict valuation multiples years into the future using only information we have today.
The first thing we looked at was persistence. Below we compare the persistence of EBITDA growth to the persistence of the TEV/EBITDA multiples from 1996 to 2002 relative to random chance.
Figure 1: Persistence of Growth Rates and EV/EBITDA Multiples vs. Chance (1996–2022)

Source: S&P Capital IQ, Verdad Research. Companies are defined as persistent if they are above median in the current and all previous years.
Valuations are more persistent than growth. Even after multiple contraction, an expensive company can remain expensive relative to the market, and a cheap company can remain cheap or even get cheaper for years (as we value investors have experienced over the past few years).
To understand what future multiples should be, we first need to understand what drives present multiples. One way to do this is to run a simple model that should explain a substantial portion of the variation in valuations. Below we show a model that uses scale, risk, growth, margins, returns on capital, and free cash flow conversion to predict the current TEV/EBITDA multiple. Indeed, it explains 39% of multiple variation.
Figure 2: Model for Current Multiples (2001–2022)

Source: S&P Capital IQ, Verdad Research. Data is Winsorized and normalized so the magnitude of coefficients is comparable. Regression is done on EBITDA/TEV, and signs are reversed for presentation purposes. Growth is analyst-estimated EBITDA growth. Risk is standard deviation of assets which is annualized standard deviation of equity * (market cap / total enterprise value).
Growth is the most important variable and dominates other factors that determine multiples. Apart from growth, larger companies have higher multiples, and riskier companies have lower multiples. High gross margins and high free cash flow conversion are associated with higher multiples. Interestingly, a higher EBITDA to gross profit ratio is associated with lower multiples, which, upon investigation, appears to be because the market correctly prices mean reversion of very high and very low EBITDA to gross profit. EBITDA to assets, a measure of return on capital, has the opposite sign than we expected and is not particularly significant, also a surprise. This is worthy of more investigation at another time.
But how well do these variables persist? If we want to predict a future multiple from today’s data, it would be helpful to have a sense of what is likely to still be true in the future. Below we show the persistence of these potential explanatory variables for multiples.
Figure 3: Persistence of Explanatory Variables
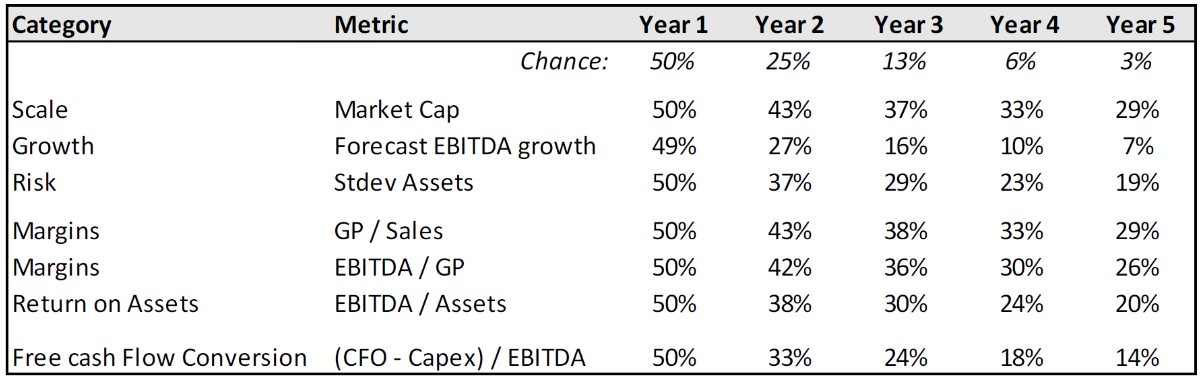
Source: S&P Capital IQ, Verdad Research
While growth does not persist at all, the other factors seem to persist at a much higher rate than chance and so should logically be predictive of future multiples. We can look at how predictive each of these variables are of TEV/EBITDA multiples three years in the future. The below table shows the regression on current multiples on the left and future multiples on the right.
Figure 4: Regression on TEV/EBITDA Multiple and 3Y FWD TEV/EBITDA Multiples (2001–2022)

Source: S&P Capital IQ, Verdad Research. Regression is done on EBITDA/TEV, not TEV/ EBITDA. Signs are reversed for presentation purposes so that positive numbers mean TEV/EBITDA increases as the variable increases.
The interesting part about these regressions is how the coefficients change for current and future multiples. Growth, as expected, becomes insignificant. Size and risk also fade as important factors.
What's interesting for our purposes is that gross profit margin and free cash flow conversion actually grow in importance to be the most important variables for future multiples. Clearly, margins and free cash flow matter to the long-term multiples after growth fades.
And this becomes even more apparent if we add starting TEV/EBITDA to the regression to predict future TEV/EBITDA. Mean reversion of the multiple is so powerful that the only factors other than starting TEV/EBITDA that matter are gross margin, free cash flow conversion and, to a small extent, size and return on capital (EBITDA/assets, this time with the sign in the direction we’d expect).
Figure 5: Regression on 3Y FWD TEV/EBITDA Multiples with Starting TEV/EVBITDA (2001–2022)

Source: S&P Capital IQ, Verdad Research.
So an analyst focused on determining the terminal multiple on a stock should start with the premise that multiples will dramatically mean revert but give companies with higher gross margins and free cash flow a higher terminal multiple than the market average. But how much higher?
Below we show the base rates of three-year forward multiples by quintiles of starting multiples, gross profit margins and free cash flow conversion.
Figure 6: 3Y FWD TEV/EBITDA Multiples by Quintile of Starting Value

Source: S&P Capital IQ, Verdad Research.
While starting multiples have a very wide range, they converge toward the median, but not completely. The fair range of multiples, as indicated by GP/sales and FCF/EBITDA is fairly tight, between 8x and 12x EBITDA. This is not full mean reversion, but it is close.
High multiple companies tend to keep a premium valuation even if that valuation tends to fall as growth is realized. But fundamentals like margins and free cash flow do in fact drive long-term valuations, and that range of valuations is very tight. Over the long run, there are mostly 8–12x EBITDA companies trading at valuations temporarily outside of that range, rather than 5–30x EBITDA companies that will stay that way forever.
This piece concludes our series on persistence and predictability of growth and multiples, but we will return to these topics in the future.