What's Priced In?
Q2's Expectations Are Low, But Nobody Can Guess For 2025
By Nick Schmitz and Greg Obenshain
The pandemic rampaging across the globe has created all sorts of uncertainties about our future health, both physical and financial. This uncertainty has led to a sharp sell-off and plummeting valuations in stocks and bonds.
Dissonant, confusing information put out in a rapidly evolving environment can create massive uncertainty about potential outcomes. And given that stocks and bonds are worth the net present value of future cash flows, the uncertainty about the future translates into heightened volatility today.
While we can’t tell you which forecasts will prove to be correct, we can assess what the market is pricing in. And since investing is a game of meta-analysis, not analysis, we can then hope to make good decisions by assessing whether that pricing is too optimistic or too pessimistic.
Perhaps the best way to analyze and contextualize this recent market action is to compare where markets are as of 20 March 2020 relative to 30 June 2009, when valuations were near their lowest in the middle of the default cycle. This is how expensive global stocks are today relative to the depths of 2009 for value and growth stocks.
Figure 1: March 2020 vs. June 2009 TEV/EBITDA Multiples
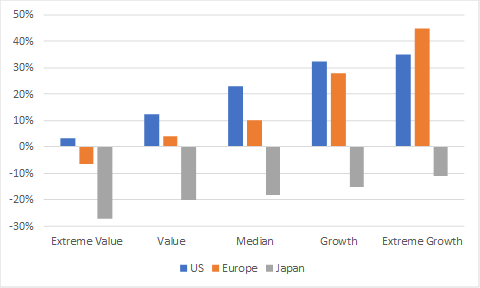
Source: Capital IQ. 10th, 25th, 50th, 75th, and 90th percentile valuation breakpoints shown in each market for extreme value through extreme growth respectively. All listed stocks excluding REITS and financials.
Growth stocks in the US and Europe are still 30–40% more expensive than 2009. By contrast, extreme value stocks are already at 2009 bottom levels in the US and Europe. According to Capital IQ, after the recent drawdown, Facebook, Amazon, Netflix, Google, Microsoft, and Apple still traded at 5.9x revenue and 12.6x tangible book value. By contrast, Japan’s TOPIX index of 2,100 stocks traded at 0.85x revenue and 1.1x tangible book value.
We believe, based on our research, that purchase prices are one of the most important determinants of returns. In Figure 2 below, we show the historical returns to value stocks compared to valuations for the cheapest stocks for each year since 1951.
Figure 2: Historical Deep Value Price-to-Cash Flow Multiples and Value Returns
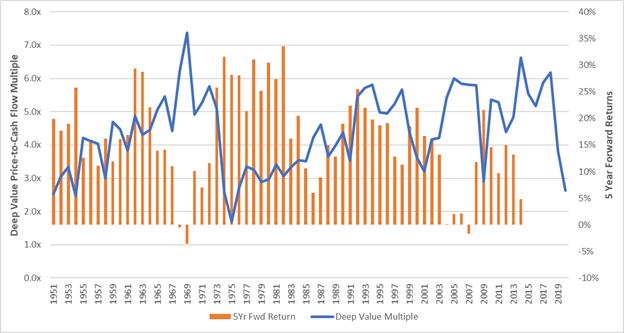
Source: Ken French, Verdad Analysis, pricing through 20 March 2020
The five-year forward returns from the Ken French data over the long term have closely tracked valuation multiples at entry. And, as you can see from the chart, today’s valuations for deep-value stocks are at extreme lows relative to history. To get lower than this in 1975, it took these scary things: 10% unemployment, Watergate, the loss of Vietnam after the death of 60K GIs, an oil embargo, hyperinflation, JAWS (1975), Global Cooling, Dutch Elm Disease, Jimmy Carter, and scariest of all, Jane Fonda. We’re not aware that any of these things impacted corporate financials five to ten years down the road. And these brief windows of extreme pessimism and low purchase multiples were all accompanied by really bad upsets to short-term GDP growth rates and employment figures.
Correctly predicting negative short-term GDP and employment outcomes and avoiding the market after it had sold off was a horrible investment strategy. We previously wrote about our friend Russell Pennoyer’s idea of a Prosperity Index (GDP growth minus the unemployment rate). We found that the worse the prosperity index was, the better future stock return.
Figure 3: Stock Returns vs. the Prosperity Index by Quartile 1948–2018
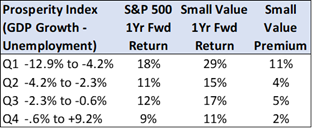
Source: Ken French, Capital IQ, FRED
Trailing prosperity and future price returns were inversely correlated because the resulting purchase prices that accompanied those GDP drops and unemployment spikes were extremely low. This relationship between entry multiples and returns is one of the most robust historical patterns in stock investing over long horizons and has been replicated internationally.
But what about bonds? Like equities, higher yields have led to higher returns, with caveats. In Figure 4 below is the yield of BB-rated bonds, the highest-quality high-yield bonds, overlaid with subsequent five-year realized return. Unless the end of your five-year hold period coincides with a spike in yield (decline in price), you can potentially earn the return you signed up for. Even if your hold period includes a spike in yield, the worst performance can be avoided so long as you hold through the spike.
Figure 4: BB-Rated High Yield vs. Subsequent 5-Year Return

Source: Bloomberg
This is because the default experience in BB credit is manageable. In Figure 5 below is the historical default experience for the best and worst of high yield.
Figure 5: Defaults in Highest-Quality High Yield (BB) vs. Lowest-Quality High Yield (CCC/C)

Source: S&P Global Ratings
The chance of default has shown to be radically asymmetrical within high yield, and thus the estimated probability of earning the yield is radically lower in CCC if we assume that we will enter a default cycle like 2001 or 2009.
Below in Figure 6 is the yield of the CCC corporate bond index graphed with the subsequent five-year realized return. CCC is the lowest-quality portion of the high-yield index.
Figure 6: CCC-Rated High Yield vs. Subsequent 5-Year Return

Source: Bloomberg
Our analysis shows that investors have rarely earned their yield in CCC bonds and have often lost money. In fact, the only time we’ve seen investors earn their yield in CCC bonds is toward the end of yield spike cycles, if they were able to perfectly time the recovery.
In debt, we believe the price (or yield) is your better indication of return, until you take on so much risk that yield is eaten away by credit deterioration and loss.
So, while macro-economic analysts are correctly worried that GDP will contract, unemployment will increase, and corporate debt will enter a default cycle in the coming quarters, we do not need to know precisely how the economy will unfold. Really bad times are already priced in for the next quarter, with complete uncertainty for the decade after that. But the investment imperative at this point becomes relatively simple in concept if not execution. In our view, it’s buying cheap securities that likely won’t experience bankruptcy. In debt, we think the place to do that is higher-quality high yield. In equity, we think the place to do that is deep-value equities that are also statistically unlikely to go bankrupt.
Given today’s prices, even if you could correctly predict the next two quarters’ GDP, unemployment and default rates to within a metaphorical inch, you could still misjudge the risk you are actually taking over the next five years, given today’s prices, by a mile. When prices drop this much on short-term bad news, and nobody can tell you what 2025 will look like, we think it’s a good window to invest long term with some basic prudence.