The Bubble 500
Are the stock prices of trendy growth stocks justified by fundamentals?
We have written frequently about the high valuations of US growth stocks. A common rebuttal, however, is that these high valuations are merited by high quality.
The tech giants— Facebook, Amazon, Netflix, Microsoft, Apple, and Google (“FANMAG”)—which have driven a significant percentage of US equity market gains over the past few years, are profitable, high-growth near-monopolies that have also been innovation powerhouses. And, in aggregate, they have achieved 26% profit margins, a 9% return on assets, and a 22% annualized three-year revenue growth rate.
Figure 1: FANMAG Quality Statistics

Source: Capital IQ
These lofty growth rates, margins, and returns on assets are rewarded by the market with heady valuation multiples. The FANMAGs in aggregate trade at 7.7x revenue and 55x earnings (a 1.9% earnings yield).
Let’s concede for the sake of argument that these valuations are justified by those fundamentals. But in so conceding, let’s also stipulate that companies with worse fundamentals should trade at lower valuations, that there is some relationship between quality and valuation anchored by the FANMAG archetypes we know so well.
What percent of the market cap of major US equity indices is accounted for by companies that are both more expensive than the FANMAG stocks and have lower quality financials? And how many companies in total fit this description? The answer is 500 of the ~3,000 US stocks with a market cap of greater than $100M, accounting for ~7% of the S&P 500 index and a whopping 25% of the Russell 2000 small cap index!
Let’s call these the Bubble 500. Here are the weighted average and median valuation multiples, growth rates, and profitability metrics for the Bubble 500.
Figure 2: Bubble 500 Statistics
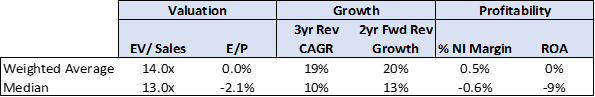
Source: Capital IQ
In aggregate, the Bubble 500 trade at 13–14x sales and make essentially zero profit in aggregate, meaning zero margins and zero return on assets. What’s interesting is the valuations for the Bubble 500 seem to be (arguably) justified solely by the difference in their forward growth expectations compared to the FANMAGs. In the broader universe of extreme growth stocks, outside the FANMAGs, it seems investors (or indexes) are paying much, much more for growth despite much lower quality.
Of course, the Bubble 500 constituents are mostly all smaller and younger than today’s FANMAGs, but we feel it’s shocking to consider that only very rarely have any of the surviving sample of today’s FANMAG winners ever traded above 10x revenue.
Figure 3: FANMAG Stocks Historic EV/Revenue vs. Bubble 500 Weighted Average

Source: Capital IQ
We seem to be paying even more today for a broad bucket of unprofitable hopefuls than we were willing to pay for the FANMAG archetypes before they survived and won their near-monopoly status.
Paying >10x revenue for exciting growth stories is historically one of the worst long-term investment methodologies ever. Our research on similarly priced, similarly unprofitable new-issue stocks with similar growth prospects suggests that this is because of their dramatically high failure rate and disproportionate risk of extreme multiple compression. And this is true even excluding the dot-com bubble. Bankruptcy-level losses occur at such high rates that the group of stocks has an actuarial price return risk equivalent to investing exclusively in tomorrow’s levered defaulters. Even if you pick an eventual lottery ticket like the six FANMAGs, at 10x+ revenue you can still lose 80% of your money on a five-year horizon at those purchase multiples due to multiple compression despite the growth. We don’t know of any long-only strategies that have as much asymmetrical downside price return risk as putting all your money in 14x revenue stocks that aren’t producing profits.
But maybe there is something different about today’s Bubble 500 stocks outside of fundamentals and growth expectations that distances them from these base rates. What stocks comprise the Bubble 500? The sector composition, shown below, is fascinating.
Figure 4: The Bubble 500 Sector Composition

Source: Capital IQ
Software, payment processing, healthcare equipment, biotech, and electric vehicles are all bets on innovation and growth, the revolutionary vanguard of the future. And the REIT valuations are driven by a few technology-related REITs that seem to benefit from an intersectional theme of low rates x high tech (e.g., American Tower, Crown Castle, Prologis, Equinix, and Digital Realty). In the Brave New Market, platforms and networks and marketplaces are in vogue, so are electric cars, software, and innovative life-sciences companies. The old economy, the real economy, main street—those types of companies seem to exist only to pay for application software, create transaction revenue for payment processors, and drive network effects for marketplace companies. We’re not sure the narratives around these industries justify the 14x revenue price tag.
Despite this, we must admit that investing in Bubble 500–type businesses has been a phenomenal “strategy” in the stock market of late. Below we show the returns of the Bubble 500 relative to the S&P 500 for the market cap–weighted basket over the past five years.
Figure 5: Bubble 500 vs. S&P 500

Source: Capital IQ
The Bubble 500 has compounded at 26% per annum versus 11% for the S&P 500, growing to account for 7% of the S&P 500 market cap and 25% of the market cap of the Russell 2000.
What has driven these abnormally high valuations for unprofitable firms? We feel narratives around the future of innovation in technology and healthcare are a clear driver, and perhaps so are falling interest rates that magnify the importance of future cash flows in a discounted cash flow model. Some believe that passive investment vehicles are driving some of these excessively high valuations, particularly in the lower-float end of the market.
Regardless of what is causing these lofty valuations, we can see that investors are placing quite a premium on growth forecasts irrespective of accounting quality or the survival base rates. We’re sympathetic to the logic of the FANMAG quality defense to the extent it applies to those six stocks, but we’re skeptical that the argument extends to the hundreds of other competing growth companies out there that are priced 40% higher but aren’t industry winners yet and don’t produce profits.
We do not believe this will persist. Neither, it appears, do the short sellers. The average stock in our Bubble 500 list has >7% short interest as a percentage of float. Some, like Ligand Pharmaceuticals, Seritage Growth Properties, Accelerate Diagnostics, Brookfield Property, Workhorse, Appian, and Cryoport are among the most shorted stocks in the market.
We don’t know when this will end, but we are firm believers that that which can’t continue, won’t.