Risk-Reward in a Hiking Cycle
Past rate hike cycles have lowered returns for all asset classes
By: Greg Obenshain
Inflation has reached the highest level in decades. The Federal Reserve finally seems to mean it about hiking interest rates. In asset markets, we’ve seen surging commodity prices and the worst drawdowns in fixed income in years. The argument against owning bonds for the last decade has been that bond yields were too low. Now that rates are rising, the bear case is that rates will keep rising and the bond sell-off will continue. Consensus wisdom has it that investors should be abandoning their fixed-income portfolios as fast as possible.
We disagree. We believe there’s a strong practical argument for a large allocation to fixed income today. The argument is simple: rising rates tend to be bad for all asset classes, and fixed income actually tends to perform relatively well, with significantly lower drawdowns.
The below chart shows the Federal Funds Rate since 1954, highlighting rate-hiking cycles. We defined rate-hiking cycles as the Fed having hiked rates in the previous month or maintained rates and define an easing cycle the same way.
Figure 1: The Federal Funds Rate with Hiking Cycles (Gray Bars) (August 1954 – March 2022)

Source: FRED. Verdad Analysis. Target rate from October 1982. Uses the Fed Funds Effective Rate prior to 1982, defining a hike as a greater than 0.20% move.
Notably, hiking cycles were much more prevalent from 1954 to 1982 (71% of months versus 39% after), so that period will be of particular interest, especially given the inflation dynamics that were playing out then. Below we show asset class returns for the entire period by hiking or easing cycle.
Figure 2: Asset Class Returns and Drawdowns during Hiking and Easing Cycles (1954–2022)
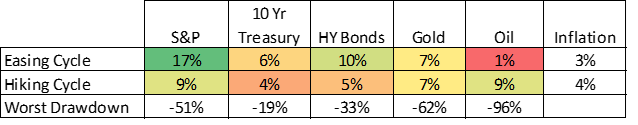
Source: Bloomberg, Robert Shiller data, Morningstar SBBI datasets, Verdad Analysis
Except for commodities, all asset classes appear to do worse during hiking cycles. The gap between stock and bond returns is significantly smaller when the Fed is hiking. The S&P outperformed 10-year Treasurys by 11% during easing cycles but only by 5% during hiking cycles.
We can look even more specifically at the period from 1970 to 1982, the period most in investors’ minds when they worry about bonds.
Figure 3: Asset Class Return and Drawdowns during Hiking and Easing Cycles (1970–1982)
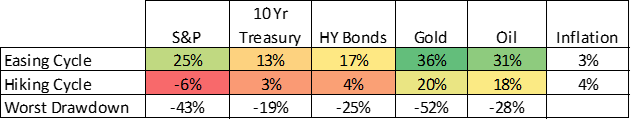
Source: Bloomberg, Robert Shiller data, Morningstar SBBI datasets, Verdad Analysis
The results are astonishing. During the 59% of the months that the Fed was hiking, nominal equity returns were negative and real equity returns were deeply negative, all while annual inflation averaged 8.6%. In these hiking periods, all classes of bonds outperformed equities. And they did this with lower drawdowns. The vaunted inflation protection of equities came during the easing cycles. Bonds did a better job of offsetting inflation in tightening cycles.
The point of this is not that fixed income will outperform equities or that we will repeat the 1970s. The point is that, in hiking environments, the risk-reward for owning equities becomes worse, and investors should look to diversify away from an all-equity book to preserve their capital for a better time. As bad a hiking cycles were in the 1970s, preserving capital for easing cycles would have been a terrific strategy.
The attraction of bonds in a rate-hiking environment is that they do a better job of preserving capital while delivering some return to offset inflation. And by bonds, we do not mean only long-dated Treasurys. Treasury returns are useful for studying the past, but there are shorter-dated options in the Treasury, investment-grade, and high-yield markets that are now at attractive yields.
A final observation on the state of the world. While equities are not in a particularly deep historical drawdown, Treasurys are. The drawdown of 16% that began in July 2020 is now the fifth worst on record in our data, even though it would barely register on a list of historical equity drawdowns.
Figure 4: Worst Historical Cumulative 10-Year Treasury Drawdowns (1954–2022)

Source: Bloomberg, FRED, Verdad synthetic ten-year Treasury return series
And here are the subsequent six-month bond returns for all of the drawdowns in the chart above. The average is 4.9%, with relatively few instances of continued severe drawdowns.
Figure 5: Subsequent 6-Month Returns for the Worst Drawdowns
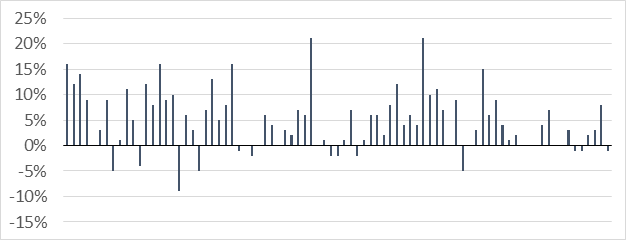
Source: Bloomberg, FRED, Verdad synthetic 10-year Treasury return series
Bonds are contracts with coupons and maturity dates. They do not go down forever. In a hiking cycle, the winning strategy has been to diversify into those assets with lower drawdowns to preserve capital for a future opportunity.