Making Private Equity Great Again
From 1990 to 2010, private equity returned 14.4% per year, compared to 8.1% per year for the S&P500 index. This 6.3% outperformance was net of private equity’s “2 and 20” fee structure, meaning that the gross return of private equity over this period was more like 20% per year.
Figure 1: Private Equity vs S&P500 Total Return (1990–2010)

Source: Cambridge Associates, CapitalIQ
As a result of these two decades of outperformance, the vast majority of institutional LPs believe private equity will continue to outperform the broader market.
Figure 2: Investor Expectations for Private Equity Returns over Public Market Returns

Source: Preqin
This makes sense theoretically. Private equity firms are leveraging their investments 1:1 and investing in small, illiquid companies, so investors should earn a size and illiquidity premium in addition to getting their leveraged returns. And so investors have poured money into private equity. From 1996 to 2010, private equity firms raised on average $186 billion per year. From 2011 to 2016, private equity firms raised on average $295 billion per year.
Figure 3: Aggregate Capital Raised by US Private Equity Firms ($B)

Source: Preqin
The consensus that private equity will outperform public markets is strong. But nobody ever made money agreeing with the consensus, and private equity LPs have missed a tectonic shift in the private equity market. Private equity has, on average, underperformed the public equity market since 2010.
Figure 4: Private Equity vs S&P500 Total Return (2010–2016)

Source: Cambridge Associates, CapitalIQ
The financial crisis drove a significant shift in the dynamics of the private equity asset class by reminding investors of how painful the volatility of public equity markets could be. The grass looked greener in private markets, where returns had been higher for decades and where reported volatility was much lower. Private equity seemed to solve the two biggest problems for large institutional investors: low yields and highly volatile public markets. And, as a result, private equity became the asset class of choice, a selection cheered on by the investment consultants for whom private funds were a core competency.
But there’s no free lunch in markets. The vast influx of new money drove prices up, drove leverage levels into dangerous territory, and diminished the excess return potential of LBO deals.
To fully diagnose what ails private equity, however, we need to understand how private equity traditionally differed from public equity investors and examine what has changed in the post-crisis era.
There are three key differences between private and public equity.
First, private equity deals are significantly smaller than broader public benchmarks. Below is a table showing the equity capitalization of private equity buyouts compared to the Russell 2000 and S&P500 indices.
Figure 5: Size of Private Equity Investments

Source: CapitalIQ, Pitchbook
Second, private equity deals are significantly more leveraged than the typical public equity. The average net debt to enterprise value ratio at inception for private equity deals is approximately 50%, compared to about 16% for the average small-cap public company.
Figure 6: Net Debt/EV of Private Equity Deals vs Public Markets

Source: CapitalIQ, Pitchbook
Private equity deals are much smaller and much more leveraged than public equity investments. These two factors, however, did not change before and after the financial crisis. Private equity deals are roughly the same size and use roughly the same percentage leverage as before the crisis. While these two factors explain what's different about private equity, they do not explain the post 2010 performance drop. This requires examining a third factor - one that forms the core of Verdad's investment strategy,
The third difference between private equity and public equity is that private equity firms have historically bought at a significant discount to public equity markets.
Figure 7: Median EV/EBITDA Multiples of Private Equity vs S&P500

Source: Pitchbook, CapitalIQ
Here we see a significant shift from before the financial crisis to after. Since the crisis, the flood of money into private equity has driven up purchase prices significantly, eliminating the formerly large gap between private market and public market valuations.
This is more troubling than most market observers understand. Private equity is extremely price sensitive because of the use of debt. Higher prices require more debt, leading to higher interest costs and higher risk of bankruptcy.
Figure 8: Free Cash Flow Yields vs Purchase Prices at Constant Leverage Ratios
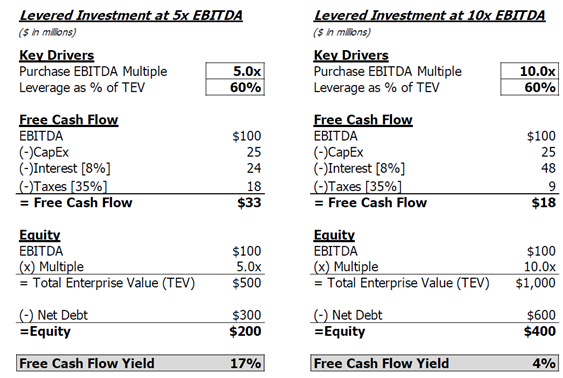
Source: Verdad
The base rate of return on private equity deals done at >10x EBITDA is poor. Historically, over 50% of deals done at >10x EBITDA have lost money. The aggregate multiple of money has been barely 1.0x, and the IRRs have been lower than 5%. Below is a backtest of a simple “expensive LBO” screen, an equal-weighted portfolio of all liquid public companies trading at >10x EBITDA with >5x Net Debt/EV.
Figure 9: Portfolio 123 Backtest of Expensive Leveraged Equity Strategy
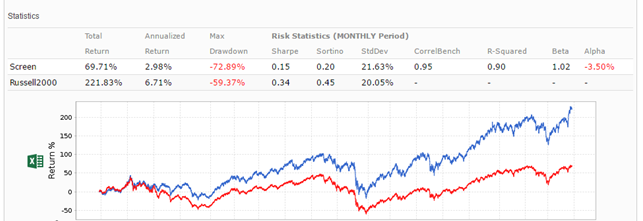
Source: Portfolio123. Russell 2000 small-cap index is in blue, while the screen is in red.
This backtest underperformed the market with worse drawdowns and higher volatility. Private equity deals and public equity investments made with these quantitative parameters are poor, as further evidenced by the lackluster track record of private equity since 2010. These metrics are, of course, foreign to most private equity investors. This is because private equity firms mark their portfolios, rather than relying on a market price. This deceives many investors into thinking that private equity (highly leveraged micro-cap) investments are less volatile than the public markets, which is a statistical illusion. In his paper, “Private Equity’s Diversification Illusion,” researcher Kyle Welch points out that “private equity returns, based on prior methods of valuation, understate the systematic risk of private equity.”
So how can we make private equity great again? What can LPs and GPs do to return to the golden era when private equity actually outperformed? The answer is simple: price discipline. Using debt to buy small companies at significant discounts to public equity markets is a well-proven money making strategy. Using debt to buy small companies at double-digit EBITDA multiples is a recipe for failure.
We believe there are three alternatives.
Invest in search funds and other micro-cap private equity deals where purchase prices are still low.
Invest in private equity firms (like Apollo Global Management) that maintain strict price discipline.
Invest in public equities that look quantitatively like the best performing LBOs, trading at <7x EBITDA, with >50% net debt/EV, and below $1 billion of market capitalization (like the Verdad Leveraged Company Fund).
The table below compares these alternatives to the current state of the private equity market.
Figure 10: Quantitative Characteristics of Alternatives Compared to Broader Private Equity

Investors shouldn’t be fooled by clever marketing about volatility dampening or claims about future returns based on past returns when the asset class was very different. Excess returns in private equity came from buying assets cheap and using debt wisely, not by using debt to pay big prices for trophy assets, all while hiding the underlying volatility of these leveraged microcaps from investors.
We believe the better course is simply to buy cheap, highly leveraged companies in the public markets, replicating the quantitative characteristics of the best performing LBOs. It’s a strategy that’s served us and our investors well.