Investing in Banks
Real estate prices can predict bank stock performance
By: Eddie Duszlak
Financials account for 10-20% of major equity benchmarks. Yet many investors steer clear of banks and insurance companies. Analyzing the balance sheet risks that drive the performance of financial institutions is often too complex or too foreign for many financial analysts. And the challenge is even greater for quantitative analysts, since standard ratios often don’t apply to financials, and so much information about the balance sheet isn’t easily legible.
Yet this difficulty also creates an opportunity. For the past three years, I’ve been studying US bank stocks, trying to figure out how to develop quantitative models to predict returns and how to integrate balance sheet data into more standard quant models. Dan invited me to share some of my findings this week and explain what quantitative analysis reveals about the drivers of bank stock performance.
Understanding US bank balance sheets is simpler than you might expect, because the dominant driver for most banks is the same: local real estate prices. For the 4,951 banks reporting to the FDIC, loans secured by real estate represented 48.3% of net loans and leases as of the end of Q3 2021.
Local real estate prices can also serve as an indirect indicator by measuring the health of a local economy. The health of a local economy is important in evaluating commercial and industrial loans, which made up 20.9% of FDIC banks’ net loans and leases as of the end of Q3 2021. As such, local real estate prices are the key driver of almost 70% of the loans on a bank’s balance sheet.
Bank performance, therefore, should be driven by the performance of the local real estate markets in which the bank is making loans.
To make this tangible, consider Seacoast Banking Corp of Florida (ticker: SBCF), a 62-branch Florida-based bank headquartered just north of Palm Beach. Real estate prices in Florida are more volatile than the national average, and Seacoast has experienced its share of highs and lows.
As shown in Figure 1 below, from early 2002 to mid-2006, real estate prices in Seacoast’s core markets consistently ranked in the top quintile of national real estate markets. Over this period, Seacoast’s stock increased from an adjusted close price of $54.1 to a peak of $144.7, generating annualized returns of +23.4% for its shareholders.
In late 2006, Seacoast’s core markets experienced a sharp correction and fell into the bottom decile for most of the next five years. Seacoast shareholders had to endure a peak-to-trough drawdown of over 90% during this period.
Then, in 2012, Seacoast’s core markets returned to the top of the national rankings. In the ensuing five years, Seacoast’s stock generated a +173% return, handily outperforming its peers.
The chart below compares SBCF’s share price (blue) to the health of SBCF’s local real estate market (orange), expressed in terms of deciles relative to national prices. This local real estate health metric compares the percentage change in SBCF’s local real estate markets to the percentage change in national prices during each period. This is then expressed in terms of deciles, with higher decile rankings pointing toward a stronger local real estate market relative to the national average.
Figure 1: SBCF Stock Price vs. Health of SBCF’s Local Real Estate Market

Source: Zillow, Virtuent
While Seacoast serves as a great case study of how local real estate prices affected an individual bank stock around the global financial crisis, real estate has also served as a driver behind bank stock dispersion in the more recent period.
Over the last 18 months, the dominant theme in US real estate has been people fleeing larger, high-cost cities for mid-sized, lower-cost cities due to COVID and increased flexibility around remote work. During this period, Nashville has been one of the hottest real estate markets in the US. Meanwhile, New York City, while starting to recover, has been one of the weakest real estate markets. This has played out in two bank stocks—Reliant Bancorp (ticker: RBNC) and New York Community Bancorp (ticker: NYCB). Reliant Bancorp is headquartered in Brentwood, Tennessee, a suburb of Nashville. New York Community Bancorp has a heavy geographic concentration around New York City. The chart below compares the cumulative return of investing in RBNC (orange) versus NYCB (blue).
Figure 2: Reliant Bancorp vs. New York Community Bancorp (June 2020 to December 2021)

Source: Capital IQ
This can be systematized across banks and tested using historical data. Zillow makes years of real estate price data with zip code–level granularity available to the public, enabling this idea to be tested for statistical significance across a large sample set of hundreds of liquid bank stocks, with tens of thousands of branches operating in thousands of zip codes.
Figure 3: Trailing 12M % Change in Real Estate Prices by Zip Code, De-Meaned
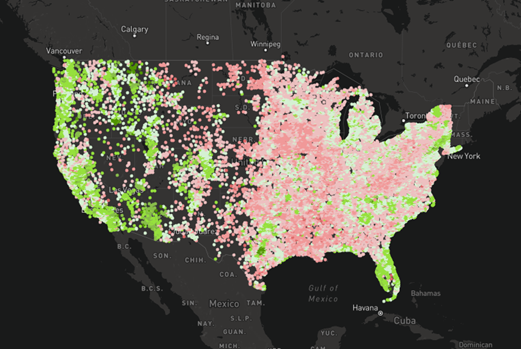
Source: Zillow
While this data can be tracked visually in a map, it is more useful when one can systematically rank each bank by the health of its local real estate market.
The starting point in this exercise is to determine which zip codes matter more to which banks. One can gauge the importance of a zip code to a bank by seeing where each bank has branches and the deposit amounts held by customers at these branches. The zip codes of the branches with the most deposits should be most important to a bank. This is a tedious exercise, as it must be done across 90,000+ bank branches, 40,000+ zip codes, and almost 5,000 banks.
Once it is combined, however, it can act as a strong and consistent predictor of bank stock prices. When splitting up 357 of the most liquid banks into quintiles based on the percentage change in local real estate prices over a three- to six-month interval, it is clear that the worst performing markets have underperformed the best performing markets over the last 20 years.
Figure 4: Bank Quintile Returns (De-Meaned) by % Change in Local Real Estate Prices (2002–2021)

Source: Zillow, Bloomberg, Virtuent
Local real estate prices have not just acted as a predictor over the full period, but they have also been a very consistent predictor. The spread between the top decile and bottom decile of stocks ranked by this factor has persisted through multiple market environments.
The chart below shows how a Jones-model (250% gross exposure, +50% net exposure) hedge fund strategy going long the top 25 and short the bottom 25 using this factor would have performed relative to financial equities and REITs over the last 20 years. The strategy not only outperforms, but it does so with less than half the volatility (13.7%) of these two indices.
Figure 5: Cumulative Return of Long/Short Bank Strategy Using Local RE Model vs. Financials & REITs (2002–2021)

Source: Zillow, Bloomberg, Virtuent
Local real estate prices have served as a consistent and powerful predictor of bank stock prices in the US for the last 20 years. While many investors write banks off as difficult to analyze, this simple concept of using local real estate prices to explain the variation in individual bank stock prices can serve as a critical input in an investor’s bank stock selection.
This is not the only relationship I’ve found in bank stocks, but it is one of the most impactful. Because they are heavily regulated, banks are forced to provide the public with additional transparency beyond that which is required of other industries. This results in more granular data relative to what is found in many other industries, making banks well-suited to implementing an industry-specific, data-driven investment strategy.
Acknowledgment: Eddie Duszlak is the CIO of Virtuent, a systematic, market-neutral hedge fund focused on small-cap banks.