How Does Quality Work?
Asset growth drives returns for high profitability companies
By: Greg Obenshain
One of the defining features of US stock performance over the past decade is the high quality of the best performers. The rapidly rising valuations of the high-flying tech stocks have been accompanied by incredible financial performance. These are not valuations underpinned by eyeballs, although there are some of those in the market as well. Quality has outperformed for the past decade, and there is a large body of academic research that confirms that the quality factor works over long histories.
We wanted to understand how quality works. What are the underlying drivers of quality stock outperformance? To explore this question, we first needed a workable definition of quality. There are many definitions, and they can include profitability, low volatility, higher payout ratios, measures of accounting quality, and leverage, but the common attribute is almost always high profitability. While profitability itself can have many definitions, we used gross profits to assets (GP/A) to study this question. In his seminal 2014 paper on quality, “The Other Side of Value,” Robert Novy-Marx found that gross profit divided by total assets tested better than earnings or free cash flow measures.
And to compare quality to value, we also used a gross profit measure, gross profit to enterprise value (GP/EV). This is the inverse of the valuation multiple (EV/GP). We express it this way simply because low EV/GP (high multiple) stocks have lower returns in the data, so it is convenient to compare low GP/Assets, which also have lower returns. Neither of these measures is perfect, but they will work well to illustrate the different factors’ mechanisms of action.
So how have our measures of quality and value performed? Below we show annualized returns by decile for quality and value since 1996.
Figure 1: Annualized Returns for Quality and Value by Decile (1996–2021)

Source: Capital IQ. June 1996 to June 2021. Rebalanced each June. All companies in the Russell 3000 ex financials and utilities. Companies with market caps below $300 million excluded.
Both factors seem to work about as well as each other, both in term of absolute return in the top deciles and how they spread returns across deciles (returns fall off sharply below the sixth decile).
But this chart hides a remarkable difference in when these factors work. One way to see this is to look at how well these factors spread returns over time. We measure the spread of returns by looking at the performance of the top 20% (quintile) of companies minus the bottom 20% over time. If the factor is working, this total return index should climb. If not, it should fall. Below we show the total return indices for these factor spreads. What matters is if the line is going up or down.
Figure 2: Top Minus Bottom Quintile Return Indices for Quality and Value Factors (1996–2021)

Source: Capital IQ. June 1996 to June 2021. Rebalanced each June. All companies in the Russell 3000 ex financials and utilities. Companies with market caps below $300 million excluded.
And the story is very clear. Value did very poorly in 1997–2000 and 2018–2020, leading into recessions, but it did phenomenally coming out of those recessions. If the economy is doing well, value is doing well. Quality, by contrast, did well in 1997–2003 and 2017–2020 but didn’t add much value during the period from 2003 to 2017. Importantly, however, it did not have the same periodic poor performance as value and managed to do well leading up to and during the 2000 and 2020 recessions.
But this is a short time period, and it’s hard to read too much into the data. We can use the Fama French dataset to look at a longer time period and see how the Fama French definitions of quality (high operating profit) and value (high book to market) for large companies performed in different growth environments. To define the growth environment, we use our quadrant definitions from “The Best Macro Indicator.” Quadrants 1 and 2 are recovery and growth, when the economy is doing well, while quadrants 3 and 4 are overheating and recession, when growth is slowing or negative. Below we show the relative returns of quality and value, specifically quality minus value.
Figure 3: Quality Minus Value Returns (Annualized) by Economic Environment

Source: Ken French Data Library, Verdad Analysis.
Again, the pattern is clear. Value returns are higher than quality returns in good times (recovery and growth), but quality does much better during slower growth periods (overheating and recession).
But it is not just the path of quality and value returns that are different. The type of stocks these strategies select is also very different. We can see this by looking at the average EV/Assets, or the asset multiple, of the companies in each quality and value decile.
Figure 4: Average EV/Assets by Quality and Value Deciles
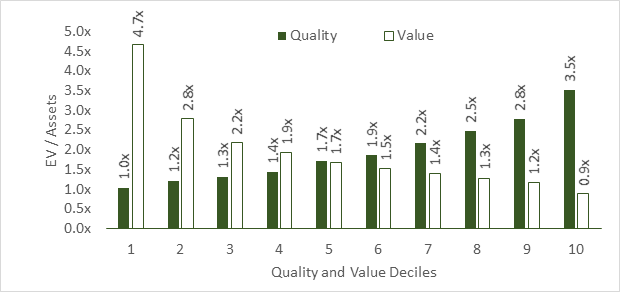
Source: S&P Capital IQ.
While value selects companies with low asset multiples, which is what we’d expect, quality selects companies with high asset multiples. Quality and value are selecting very different kinds of companies.
If both value and quality are useful for sorting companies, but they are selecting different companies and delivering different return streams, what are the mechanisms through which the returns are realized? To answer this question, we need to decompose the returns from quality and value to see where they are coming from.
To decompose the returns, we can use a methodology similar to the one we used in “What’s in an Equity Return?” Specifically, we can look at how much of the return comes from growth in assets, how much comes from a change in profitability (GP/Assets), and how much comes from a change in multiple (EV/GP).
Below we show the decomposition of returns for the top decile of quality.
Figure 5: Decomposition of Annualized Top Decile Quality Returns

Source: Verdad Analysis. Other includes leverage impacts, debt paydown, change in shares, and distributions.
The primary driver of quality returns is growth in assets. Profitability decreases, which makes sense as profits across the economy mean revert and high profits should get competed away. Valuation multiples improve, which is perhaps surprising, as they generally begin at elevated levels, but this improvement only just offsets the contraction in profitability. High quality companies mostly deliver returns by getting bigger.
Contrast this with the drivers of top decile value returns shown below.
Figure 6: Decomposition of Annualized Top Decile Value Returns

Source: Verdad Analysis. Total Return does not exactly match total return for decile 1 in Figure 1 due to rounding. Other includes leverage impacts, debt paydown, change in shares, and distributions.
The top decile of the value factor delivers returns through change in multiples. The companies have anemic asset growth, and profitability does not improve. But multiples do. This reflects our understanding of how value works. Low multiples often reflect poor earnings. But while earnings may continue to be poor, they are not as bad as was priced, so multiples improve.
Value is the racecar, hard to beat, but prone to accidents around the curves. Quality loses to value much of the time but is much more consistent and performs better when growth slows. There is one final difference that matters to investors. Because value derives from market valuations, which are volatile, while quality derives from company profitability, which changes more slowly, companies in the quality portfolio tend stay in the quality portfolio with lower turnover than companies in the value portfolio. In our dataset, quality companies were likely to still be in the portfolio three years after being added, while value companies were likely to be out of the portfolio after two years. Value requires more frequent rebalancing than quality.
Both value and quality deliver returns, but they work through different mechanisms, they often work at different times, they select completely different types of companies, and they require different levels of active management.