Growth Bankruptcies
Let’s play “Would You Rather.” Would you rather invest in the latest high-growth tech IPO or in a long-established firm with a decent amount of debt whose best days are behind it? Human experience tells us that retirees have shorter life expectancies than teenagers. This intuition might lead investors to be more worried about the risk of permanent capital loss in old, indebted businesses than young, high-growth new issues.
But is this correct? Are investors more likely to lose money betting on an aging company that owes the banks money or in today’s bell-ringing darlings of Wall Street? We decided to run the numbers and see.
Our conclusion is that, by far, we believe the easiest way to lose nearly all of your money is IPOs, and the more exciting the IPO, the more the catastrophic the base rates. For those watching the recent near-death experience of WeWork as it limps along at about one fifth of the value it was about to IPO at just last month, or the slew of disappointing results from high-growth high-expectation IPOs like BlueApron, you would be right to ask how extraordinary these “shockingly” bad outcomes really are.
Of the last 3,700 US IPOs since the late 1980s for which we have data, the median IPO lost about 31% of its value from day-one close price to three years later and 41% to five years later. But what is most astounding is just how frequently investors lost a lot more than that. Below we’ve highlighted not just the percentage of time investors would have lost money, but the percentage of time investors would incurred bankruptcy-level losses of more than 75% of their capital.
Figure 1: IPO Five-year Buy-and-Hold Price Return Base Rates by Sector
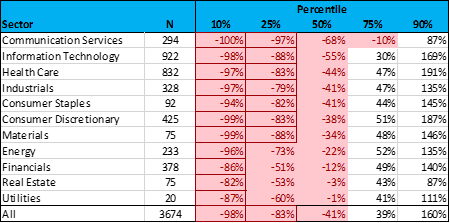
Source: Capital IQ, all IPOs since the late 1980s with transaction data available. From day-one close price to five-year hold or delisting.
Buying and holding IPO stocks, you would have lost about half of your wealth half of the time and 75% or more of your wealth in one out of three or four IPOs. And according to the data, the most toxic of these growth-bankruptcy-prone IPOs have been the seemingly most exciting technology and communications stocks, where you would have lost about 60–70% of your wealth half of the time (like SnapChat within its first two years) and 90% or more of your wealth in almost 25% of IPOs (like BlueApron within its first two years).
And it’s not just the trendy industries that were correlated with bankruptcy-level losses. All measures of excitement and optimism were correlated with long-term loss of capital. Below we show how much the market traded up new IPOs at open on the first day of trading (from offer to close price) compared to their subsequent long-term median price return. We also compare the first-day valuation multiple of IPOs to their subsequent long-term median price return.
Figure 2: IPO Returns by Day-1 Stock Performance and Day-1 Valuation Multiple

Source: Capital IQ, all IPOs since the late 1980s with transaction data available.
And these aggregate results are not that dramatically skewed by the tech bubble. Professor Jay Ritter, the country’s leading academic on IPO stats, found essentially the same failure rates when measuring all 8,000 or so IPOs dating back to the 1970s—almost half of IPOs lost more than half of their wealth over five years, as depicted in the chart below.

Source: Ritter
Unlike actual bankruptcies, most of these firms don’t blow it for investors through explicit reorganization or liquidation. According to the Kauffman Foundation’s look at about 1,500 IPOs, only about 10.5% of them “fail” explicitly, with a third of them getting acquired after five years and half of them continuing operations beyond five years.
But this 11% explicit failure rate masks the high probability of catastrophic outcomes in the base rates above. The base rates above suggest the most probable outcome for betting the boat on an IPO is extreme disappointment and investor insolvency, whereas only about 1/100 are the kind of 10x or more fat pitches that would help make up for the catastrophic losses you’re taking on the typical investment.
So let’s go back to our game of “Would You Rather.” Even knowing what we know now about catastrophic losses on IPOs, older firms with debt on their balance sheet today and low growth rates still sound pretty scary.
But what are the rates of doom? According to Standard & Poor's, under 1% of global investment-grade corporate debt and about 4% of speculative-grade corporate debt defaults each year. The annual rate changes with economic cycles, but over time, the five-year default rates are pretty stable when sorted by credit quality.
Figure 3: Standard & Poor's Default Rates

Source: Standard & Poor's
But most firms that default don’t immediately go through bankruptcy, and many go on to thrive. This is not unlike the fact that most people who miss a mortgage payment don’t automatically go into foreclosure. For example, according to Standard & Poor’s, in 2018 only 28% of firms that defaulted subsequently ended up in Chapter 11. We analyzed the last 885 corporate defaults over 11 years recorded by Moody’s going back to 2007 and found that only about one third of defaults went into bankruptcy court, one third just missed an interest or principal payment without going into bankruptcy, and one third settled the dispute between lenders and borrowers outside of the court system through what are called “distressed exchanges.”
If we assume Moody’s data on corporate defaults is accurate1, the base rates for the probability of encountering various event outcomes in levered equities would look something like the estimates in Figure 4 below:
Figure 4: Corporate Default Rates and Estimated Post-Default Event Occurrence1

You can see that it makes a huge difference if you are invested in companies with 3–4x EBITDA of debt around the BBB-BB range or if you are at or above the 5x levels that the private equity industry borrows at today (5.8x “adjusted EBITDA” according to Pitchbook which is “highly aggressive” by ratings agency standards).
But what do these outcome probabilities mean for actual investors in the stock of the companies? While “loss-given-default” and recovery rates for debt investors are commonly tracked, loss-given-default for equity investors is seldomly tracked or calculated in the literature (see here and here for bankruptcy). But for the roughly two thirds of post-default events that don’t end in formal bankruptcy court, we can’t find much data at all. One older study comparing distressed exchanges to bankruptcy found significantly higher recovery rates and about 4x less dilution for equity owners settling their defaults out of court in distressed exchanges.
While we can assume, based on the data, that a stock investor loses 100% in a chapter-seven liquidation and ~90% in chapter-eleven reorganization, the literature suggests distressed exchanges seem more forgiving for equity holders. And the third of defaults that don’t result in any of those outcomes shouldn’t lose much more than the market over the next five years in theory. So what we would expect is about one third of defaults to result in a 95% loss (formal bankruptcy), one third to lose about 70–80% (out-of-court settlement), and one third to do about what the market does.
To check, we tested the price return of the worst possible investment methodology ever devised: we picked 100% of all companies at year start that did in fact default during the next year and held the stock of those defaulters for five years or to delisting. We compared the default results side-by-side with the results of all IPOs and tech IPOs. Like all tech IPOs ever, about a third of defaults were catastrophic, a third were ugly, and a third kind of looked like the market, plus some lottery winners. And this is comparing only the vast minority of the worst-possible levered equities to your run-of-the-mill IPOs!
Figure 5: IPO vs. Only Default 5-Year Price Return Distributions2

We estimate that, if you consider the ~90% of levered equities in a hypothetical AAA through CCC/C diversified portfolio that don’t default over a five-year horizon, you would need about an ~85% cumulative default rate in your levered equities to make the base rates for levered equities look as scary as tech IPOs. BBB- and BB-rated firms have only defaulted at 2% and 8% respectively through the credit cycles since 1981 according to Standard & Poor’s.
Based on our analysis, it’s hard to make the case that the long-term base rates for bad outcomes in levered equity investing are anywhere near as scary as the IPO base rates. IPO stock prices suffer from the harsh bigotry of high expectations. By contrast, levered value firms benefit from the soft bigotry of low expectations combined with statistically low default rates outside of junk debt.
But 2019 is the first time since the tech bubble that IPOs have been selling above 10x revenue on average with only about 15% of the stocks being profitable. This seems to be largely a consequence of the overcrowding of IPO markets with VC- and PE-backed public offerings that used to only be about 30% of IPOs but are now about 80% of offerings, as depicted in Figure 6 below.
Figure 6: % of IPOs by Backing (Left) and Tech IPO Profitability and Valuation Statistics (Right)

Source: Recreated from Jay Ritter's data.
And you’ve got to wonder, if WeWork, SnapChat, and BlueApron are the all-stars of these VC firms and still failed spectacularly in their IPOs, what makes up the rest of these private portfolios? So we’ll give the Halloween scare trophy to today’s VC-backed tech IPOs. Paying 10x revenue for companies that haven’t produced a dollar is statistically about as scary as an 85% likelihood of default in levered equites over the long haul—which they don’t have a credit rating for.
---
Methodology:
1. Source: Moody’s for equivalent-ratings leverage levels. Standard & Poor’s for cumulative default rates.
For other points of reference: S&P estimated that "Distressed exchanges accounted for the largest share of defaults (among publicly rated companies) in 2018, with 38%, followed by missed interest or principal payments (32%) and Chapter 11 filings (23%)." While Moody’s estimated 44% of defaults in the 2015 high-yield crisis went through distressed exchanges, not formal bankruptcy, and only about 30% of companies that go through distressed exchanges end up back in court over the long haul.
2. Source: Capital IQ, all IPOs since the late 1980s with transaction data available. Levered equities are all Moody’s and Standard & Poor’s defaults since 2002 with associated stock and pricing data. Returns are price returns from 30 December of the year prior to default until 5 years later or the price on the last market day the stock traded before delisting. 11.6% default rate is the average of all credit ratings’ 5-year cumulative default rate from 1981 to 2018 according to Standard & Poor’s.