EM Crisis Investing, a Deeper Dive
Understanding the Factors at Play in Emerging Markets
By: Igor Vasilachi
We have argued that the defining characteristic of emerging markets is the frequency and severity of economic crises. This has been problematic for buy-and-hold equity investors, who have been rewarded with high volatility and low returns.
But this volatility can also create opportunity. In our white paper on Emerging Market Crisis Investing, we found that investing in developing countries after a >50% equity market drawdown has historically generated attractive returns.
Today, both Russia and Turkey have experienced >50% declines in their stock markets, and China seems at risk of potentially following suit. War, inflation, food shortages, and slowing demand raise the specter of more pain ahead for developing economies.
With recent volatility, and the magnitude of the opportunity created by crises, we decided to do a deep dive on the individual security level to better understand how to invest in emerging markets both immediately following crises and during more normal times.
Completing this analysis was more complicated than doing similar research in developed markets. The data is spottier and tends to require more cleaning and scrutiny. It took us a year, using two separate databases, to build reliable data sets and complete our statistical tests across 16,000 stocks in 46 frontier and emerging markets.
We looked at the traditional quantitative factors that have been replicated in the academic literature. We apply rigorous tests to historical data when developing investment strategies, with a high bar to consider something a true predictive signal, and this study was no exception. We used three tests in looking at this data:
When we divide the data by quintile of a given factor, do we see a linear relationship between the quintiles and forward returns?
Does a regression of the factor against forward returns produce statistically significant results?
Does a backtest over the full period generate returns in excess of the benchmark?
We found that the key developed-market factors also work in emerging markets. Value and quality factors have the highest t-stats, and value, specifically, has the widest absolute top-to-bottom return spread. In a nutshell, buying cheap, high-quality stocks (i.e., highly profitable and efficient companies) works. The size factor is also statistically significant, though most emerging market small and micro caps are essentially untradeable due to limited liquidity. Below we show in-sample 12-month forward average excess returns over market returns and regression t-stats for the statistically significant factors.
Figure 1: Average 12M FWD Excess Returns Spreads and T-Stats by Factor (6/2000 – 6/2020)

Source: Refinitiv, MSCI. NOTE: In-sample includes 70% of the full sample, randomized across markets and years; N = ~11,200; accruals = difference between operating cash flow and net income.
We then created a composite score based on the factors above, in which we overweighted value and quality factors but also accounted for size. We ran the score on the “tradeable” stock universe, which we define as EM companies with market capitalization above $500M. We excluded China from the EM pool, mainly because US investors cannot trade onshore Chinese stocks. The result was a Verdad Factor Model portfolio made up of the top 50 scoring stocks, equally weighted and screened yearly.
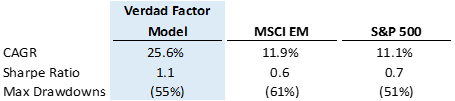
We tested whether this strategy would have improved the returns of our Emerging Markets Crisis Investing Strategy, which invests in EM value stocks during global market crises. Below we compare the performance of our EM Crisis Investing Strategy using the Factor Model to the performance of the same strategy using the MSCI EM Value Index excluding China. In addition, we compare those results to EM and US equity buy-and-hold strategies over the same time period.
Figure 2: Performance Indicators by Strategy (6/2002 – 6/2021)

Source: Refinitiv, MSCI, Capital IQ, Ken French Data Library, Verdad
The factor model produces a significant improvement over our original paper. These returns were driven in large part by tremendous equity returns after crises. By comparison, as seen in the figure below, the S&P 500 has delivered more muted 12-month forward returns in all the instances since 2002 when drawdowns exceeded 20%.
Figure 3: 12M FWD Returns in Global Crises

Source: Refinitiv, MSCI, Capital IQ, Ken French Data Library, Verdad
This model would also work as a buy-and-hold strategy, though with very high volatility. Below we compare its performance to that of EM Ken French Large Value, MSCI EM Value excluding China, and the S&P 500.
Figure 4: Performance Indicators by Buy-and-Hold Strategy (6/2002 – 6/2021)
Source: Refinitiv, Capital IQ, MSCI, Ken French Data Library, Verdad
The model works so well in large part because it dramatically shifts geographic exposures, as there’s almost always an EM crisis happening somewhere. Below we show how the regional concentration of the Verdad Factor Model portfolio shifted from Latin America in the 2000s to Asia in the 2010s.
Figure 5: Verdad Factor Model Regional Exposure Breakdown

Source: Refinitiv, Verdad
But while investing after major crises seems relatively reliable, the buy-and-hold strategy has gone through protracted periods of underperformance compared to US equities. The last decade, and especially the period from 2018 to 2020, was particularly painful to the factor model.
In addition, the risk of Black Swan events in emerging markets is much higher compared to developed ones. One must look no further than the Russian invasion of Ukraine. Even though our model would have allocated only 2% to Russia coming into 2022, it would have resulted in a mark down to zero for that name.
But for the brave, there are quite interesting value opportunities to be had. As of March 31, 2022, the average EBITDA multiple in our portfolio would have been a whopping 1x, with $2B in average market cap. In other words, this would have been a small value strategy capped at $250M max capacity. Not an easy one to execute, especially with 80% allocation to Asian stocks. As we said, this is for the bravest among us.