Crisis Investing Part IV: What Works in Stocks
This is the fourth and final essay in our series on crisis investing. To read the full 77-page report, click on the link at the end of this email.
We believe a good place to maximize returns during a crisis is in small-value equities. We wanted to understand in more granular data what specific factors predicted performance within equities in order to develop the optimal strategy within the best returning asset class.
We started with a specific set of hypotheses, based on our experience and understanding of what has worked historically for small-value equities, and what factors have the most explanatory power in forecasting returns. Our high-level hypotheses were as follows:
•Cheap stocks outperform expensive stocks in times of uncertainty
•The greatest opportunities for price dislocation come from panicked sellers in low-volume stocks
•Companies generating positive cash flow, who are less reliant on capital markets, will perform better than companies with negative cash flow
•Leverage increases the dispersion of outcomes, and can be both good and bad
We regressed forward 12-month returns against the factors listed above across the eight crises, and a summary table of the regression results, including the most impactful factors, are shown below:
Figure 1: Regression Results for Predictive Variables during High-Yield Crises
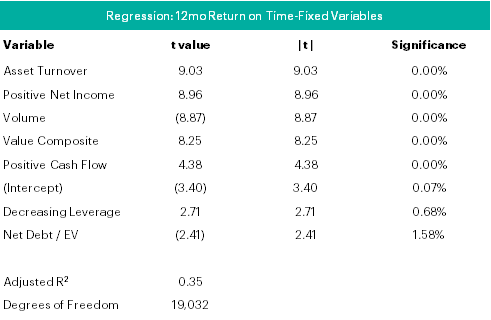
Source: Verdad analysis
As a reminder, t-stats and significance levels are measures of whether a variable helps describe differences in returns. The more extreme the t-stat, the more impactful the variable in describing differences in returns. Each of the variables above is important in describing differences in returns. The implications from the above table are significant. Across these eight crises, this short list of variables accounted for over 35% of the fluctuations in future returns. To read about each variable individually, click on the link at the end of this email to download the full report.
Each of the variables above has explanatory power on its own, as shown by the linear spread of returns by decile. It should come as no surprise that combining each of these individual factors into a multifactor model should enable us to generate superior returns. As shown in Figure 2, the multifactor model does indeed outperform both the market as a whole, and a dedicated value-only strategy (defined as the cheapest decile of the value composite factor).
Figure 2: Average Portfolio Return through High-Yield Events

Source: Verdad analysis; CRSP/Compustat. Note: Returns shown are the average of each of the eight high-yield events from 1974-2016
As shown in Figure 2, the multifactor model returns 2x the market over the 12-month period, and over 3x the market over a 24-month period. Additionally, the multifactor model returns roughly 2x what a dedicated value-only strategy would return.
While the returns and explanatory factors shown in Figure 2 may be compelling, it is worth examining what the multifactor portfolios would look like relative to the market and other benchmarks. In this section we compare how a 50-company portfolio generated by the multifactor model would compare against the total market and a value portfolio of the cheapest decile of stocks. The statistics computed below are the average of each portfolio across the eight high-yield events. We have adjusted volume and market cap to account for higher market caps from inflation in more recent times, and higher market volumes as well.
Figure 3: Portfolio Comparison

Source: Verdad Analysis, CRSP/Compustat
As the table in Figure 3 shows, the multifactor model tends to favor companies that are smaller, more thinly traded, and with less positive prior momentum. These companies tend to also have high asset turnover and more leverage than the market, or the cheapest decile of stocks.
Interestingly, the multifactor model also selects companies that are very cheap across all four value metrics, even compared to the cheapest decile portfolio. It is worth noting that the cheapest decile portfolio includes ~400 stocks, whereas the multifactor model includes only 50. Most importantly, the returns for the multifactor model across the eight high-yield events are materially higher than the US market or even a pure value strategy.
The kind of investments that the multifactor model favors are unquestionably not the most popular or well-known stocks. They are often small, with low liquidity, and can be in cyclical or beaten-down industries. However, by relying on the detailed and thorough empirical back-testing of the strategy across the last eight high-yield events, the committed investor can be confident in the strategy and the investments.
Considering the performance and persistence of the multifactor model, we hope that the power and significance of a quantitative study of crises has become evident. In times of panic, when everyone is a seller, there are tried and true rules that prepared and disciplined investors can follow to reap rewards. The performance of the strategy during each of the eight studied high-yield events is listed in Figure 4:
Figure 4: Performance of Multifactor Model vs. Market during Crises

Source: Verdad Analysis
The strategy is not 100% effective. But it can be effective, and it far surpasses the average quantitative or fundamental-based stock picking strategy. The cumulative excess returns over the market show how significant taking appropriate advantage of these opportunities can be.
Investors should consider setting aside dedicated capital for precisely these opportunities. As the historical headlines below show, investors cannot plan on keeping their heads when panic strikes. By setting aside capital to take advantage of these opportunities, smart investors are buying insurance for when a rainy day comes. We hope the findings we have illustrated here will give investors confidence and the evidence to act decisively when the opportunity presents itself.