An Apology for Small-Cap Value
"If we are intended for great ends, we are called to great hazards."
The Fama-French Small Value Index fell over 41% this quarter, the worst quarterly performance on record (with the record extending back to 1926). This sharp drawdown makes this the worst 10-year run for small value stocks since the Great Depression. Below, we show the trailing returns of the Fama-French small value index and the S&P 500.
Figure 1: Fama-French Small Value vs. the S&P 500
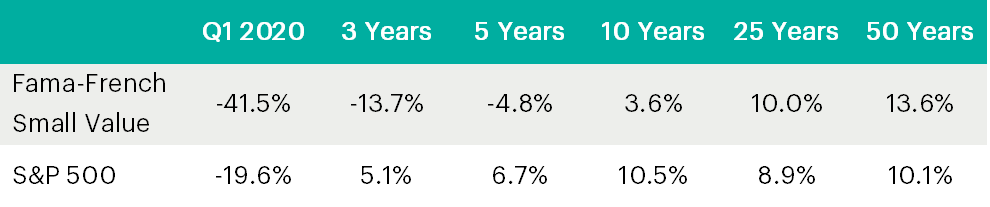
Source: Ken French Data Library, CapitalIQ
Indices have no tongues. But perhaps we can speak for the index and provide an apology for small-cap value investing. We offer an apology not in the primary sense of a regretful acknowledgment of an offense but rather in the classical sense of a reasoned defense of a position, though we perhaps feel the need for the former as much as any believer and advocate of small value.
We feel that small value deserves such an apology because, though the past few years have been painful for small-value investors, this is perhaps a once-in-a-century buying opportunity in this deeply out-of-favor asset class.
Today, the two biggest statistical predictors of future small value returns are at some of their highest readings ever on record. High-yield spreads are at 2009 levels while the growth/value price ratios are at 1999 levels—an extremely rare “double eclipse” for market historians. We will explore both the high-yield spread and the growth/value ratio and where these two metrics place us today relative to history.
High-Yield Spreads
The high-yield spread is a gauge for monitoring market sentiment for small and micro-cap companies because it combines real-world economic consequences and the temperature of the market. This economic indicator measures the spread between the borrowing rate for below-investment-grade bonds and the corresponding safe interest rate. When the high-yield spread rises, it reflects higher borrowing costs for smaller, less-creditworthy business. This is a real economic cost which impacts decisions. Additionally, the spread measures the market’s confidence in the performance of these same businesses and the associated cost required in compensation for the risk of investing.
Last quarter also saw high-yield spreads jump 520bps to 880bps, a level last seen in September 2009. We shared with you in early 2018 a study of the performance of small value stocks relative to the high-yield spread from 1965 to 2018. We found a predictable relationship. When the high-yield spread spikes, investors tend to flee from small value equities, scared that these companies will be unable to refinance their debt and that the risk of bankruptcy is significantly higher than they anticipated.
With spreads rising to levels last seen in the 2008 financial crisis, this is a once-in-a-decade occurrence in the long-term historical data. Below we show the high-yield spread since 1965 relative to the long-term median and standard deviation.
Figure 2: High-Yield Spread Since 1965

Source: FRED, Verdad research
Small value performed as expected this quarter, given the sharp spike in the high-yield spread from 3.6% to 8.8%. But as we wrote in 2018, “the recoveries from these drawdowns have been as fast as the drawdowns were painful.” Below, we show the one-year forward returns for small-cap value and the S&P 500 based on the high-yield spread. For small value, we show the returns of the smallest and cheapest 10th percentile, 20th percentile, and one third of all US stocks compared to the S&P 500.
Figure 3: High-Yield Spreads vs. Small-Value Equity Returns

Source: Ken French Data Library, Capital IQ
We saw this type of performance even in the past decade when small-value generally performed very poorly. When spreads normalized after the eurozone debt crisis, small-cap value returned 70% from 2011-2013 vs. 54% for the S&P 500. And in 2016 when spreads normalized after the energy price collapse, small-cap value returned 36% in 2016 vs. 12% for the S&P 500.
The Growth/Value Ratio
The recent spike in high-yield spreads has not been the only headwind to small-value performance, however. Another gale-force wind has been blowing: an extreme divergence in the valuations of growth and value stocks, with investors increasingly prizing growth stocks while abhorring value stocks. Below, we chart the ratio of the free cash flow yield of the cheapest 10% of stocks relative to the most expensive 10% of stocks from 1951 to 2019.
Figure 4: Valuation Spreads, 1951–2019
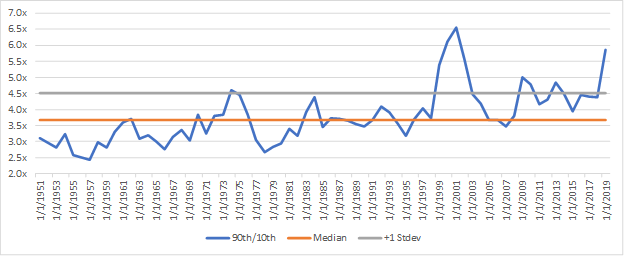
Source: Ken French Data Library
The ratio of growth-to-value stocks went from moderately high at the end of 2015 to nearly three standard deviations above the long-term median today. Historically, these valuation ratios have been strongly mean-reverting. Below, we show the one-year forward returns for small-cap value and the S&P 500 based on the ratio of the free cash flow yield of the cheapest 10% of stocks to the most expensive 10% of stocks (i.e., how expensive growth was relative to value). Today, the cheapest 10% of stocks offers about 6x the free cash flow yield of the most expensive 10% of stocks, about the same as in 1999.
Figure 5: Valuation Spreads vs. Small-Value Equity Returns
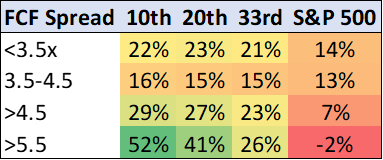
Source: Ken French Data Library, Capital IQ
From 12/31/1999 to 12/31/2006, the smallest, cheapest decile of stocks returned a total return of 530% while the S&P 500 returned 8%. We are now at the 97th percentile of the historical data.
Conclusion
Getting to those levels over the past few years has been extremely painful for small-value investors. But as the famed apologist John Henry Newman wrote, “if we are intended for great ends, we are called to great hazards.”
We believe that when the recovery begins and the market turns (and maybe it already has), small-cap value is uniquely positioned to capitalize on perhaps a once- or twice-in-a-century convergence of opportunities.