A Strategy for Emerging Market Crises
This is our third and final post on emerging markets. To download the full 55-page report, click on the link at the end of this research note.
Our analysis has so far revealed two important insights: 1) a crisis investing strategy can be an attractive alternative to buy-and-hold in emerging market investing, and 2) it is possible to reap excess returns through crisis investing in emerging markets without taking on additional risk compared to investing in established markets, such as US equities or treasuries. We set out to build an EM crisis investing strategy that would take advantage of this opportunity.
Strategy Definition
We propose a crisis investing strategy that captures excess returns from crisis investing while avoiding EM risk during times of no crisis:
Long EM large value stocks during global crises: 3-month entry lag, 24-month hold
Long EM sovereign debt during idiosyncratic crises: 3-month entry lag, 24-month hold
Long US sovereign debt when not invested in EM debt or equity: a “no-crisis” instrument
We also tested our strategy for different “no-crisis” instruments, such as the S&P 500 or cash. We found that holding 10Y US Treasuries in times of no crisis had the best risk-return profile (See Appendix Figure 13, 14). We propose unhedged USD exposure in the context of this strategy (See Appendix Section A).
Portfolio Allocation
We analyzed historical crisis occurrence and found that, on average, there are 4.3 crises unfolding at any given time in our target EM markets. We wanted to ensure that, on average, we are always invested in a “no-crisis” instrument to diversify EM risk and therefore propose a maximum equal-weighted portfolio allocation of 15% to a single country in crisis, with the remainder allocated to 10Y US Treasuries.
For example, in a period with only one EM country in crisis, we will allocate 15% of the portfolio to that country’s debt (in an idiosyncratic crisis) or equity (in a global crisis) and 85% to 10Y US treasuries. Conversely, in a period with 10 EM countries in crisis at the same time, each will be allocated 10% of the portfolio, while nothing will be allocated to 10Y US Treasuries.
We tested our logic for different allocation caps: 100% maximum allocation on one hand and equal weighting (i.e., 1/18 of the total portfolio) on the other hand. We found that a 15% maximum allocation per country has the best risk-return profile (See Appendix Figure 13).
For periods when country-level debt data is not available, we used J.P. Morgan’s EM Bond Index (EMBI) returns as a proxy for country-level returns.
Results
We contrasted the performance of our crisis investing strategy to that of buying and holding benchmarks: S&P 500, 10Y US Treasuries, MSCI EM Equity Index (proxy for overall EM equities), J.P. Morgan’s EM Bond Index (proxy for overall EM debt), and the Fama-French EM Large Value Index. In our crisis investing strategy, we used the equal-weighted EM Large Value Index, rather than the market-cap weighted index shown throughout the paper, because of the significantly higher weight towards value in the equal-weighted index and, hence, higher returns. However, it is important to note that an equal-weighted EM Large Value strategy is more difficult to execute and has more capacity issues than market-cap weighted.
We compared the returns of equal-weighted and market-cap weighted value indices for large and small EM stocks and found that equal-weighting outperforms market-cap weighting, while the cheapest and most illiquid value stocks – small stocks – outperform large ones. Although an equal-weighted EM Small Value strategy is virtually impossible to execute, this trend makes us believe that a more concentrated equal-weighted EM Large Value strategy, in which we would tilt the portfolio towards value even more, could potentially further boost the returns of our strategy.
Below we show the total period returns, average annual returns, standard deviation, Sharpe ratio, and maximum drawdown for all strategies starting in 1993 (the earliest period with overlapping data).
Figure 1: Annualized Performance Indicators by Investing Strategy, 1993–2020

Source: Capital IQ, Bloomberg, Global Financial Data, Ken French Data Library
The top-performing crisis investing strategy outperformed buy-and-hold strategies in both the United States and emerging markets by 8–13% in total period returns. Most importantly, that performance came with low volatility and limited drawdowns.
Below we show the allocation and return contribution of each instrument in the strategy.
Figure 2: Total Period Allocation and Return Decomposition
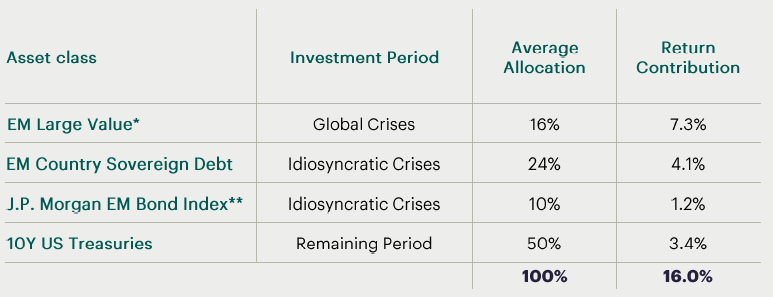
* Equal-weighted. ** Proxy in periods when country-level debt return data is missing. Source: Capital IQ, Bloomberg, Global Financial Data, Ken French Data Library
Strategy returns are boosted by the equal-weighted EM Large Value Index in global crises and country-level sovereign debt during idiosyncratic crises. While contributing a smaller relative amount to returns, 10Y US Treasuries are critical to reducing the strategy’s risk. Consequently, this strategy bears a debt-like risk profile with an equity-like return profile.
To make sure the outperformance is not driven by singular events, we have also tested these strategies on monthly 5-year rolling periods and contrasted to their benchmarks.
Figure 3: 5-Year Rolling Returns, EM Crisis Investing vs. S&P 500, 1993–2020
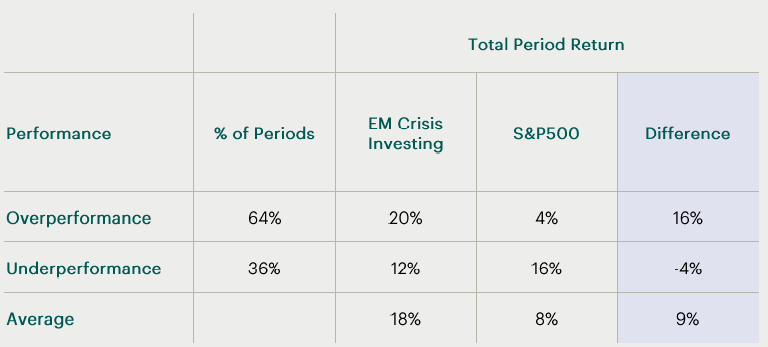
Source: Capital IQ, Bloomberg, Global Financial Data
We found that our proposed strategy would have outperformed the S&P 500 by 17%, on average, in ~70% of periods. On the other hand, our strategy only underperformed by -3% in the remaining periods.
To put this in perspective, we have detailed the 5-year performance for five full periods between 5/31/1995 and 5/31/2020, the last period with available data in our analysis.
Figure 4: 5-Year Performance of Crisis Investing vs. S&P 500, 5/31/1995–5/31/2020

Source: Capital IQ, Bloomberg, Global Financial Data
The proposed strategy would have outperformed the S&P 500 in 4 of 5 periods. This includes the two periods between 2000 and 2010 when the S&P 500 was flat or negative. In the one period when our strategy would have underperformed, we conclude that it would have done so by -3%. Interestingly, we believe our strategy would have had double-digit returns for the last 5 years, when the US Small Value segment has been flat (See Appendix Figure 15).
As a final test of the strategy's robustness, we wanted to check if there were any markets that accounted for an outsized share of the excess returns (over 10Y US Treasuries). Below we show the estimated share of contribution to total excess returns by each market in our analysis. No single market accounts for more than 15% of excess returns.
Figure 5: Share of Total Excess Return Contribution by Market, 1993-2020

Source: Capital IQ, Bloomberg, Global Financial Data
Conclusion
We feel that a crisis investing strategy that captures excess returns from crisis investing by holding EM sovereign debt and large value equities while diversifying EM risk during times of no crisis by holding 10Y US Treasuries could represent an attractive alternative to a buy-and-hold approach to emerging markets. This strategy results in equity-like returns with debt-like downside protection, based on our analysis.
Historically, this strategy was a better performer than buying and holding the S&P 500, 10Y US treasuries, overall EM debt or equities, and US and EM value stocks. In particular, this strategy beat holding the S&P 500 over the full period, 70% of rolling 5-year periods since 1993, and in four out of five 5-year periods since 1995, with double-digit returns even in periods when the S&P 500 were flat.